Help: Concepts
This page contains a description of how GPSLog Labs processes and organises your activity logs.
Places
Places are the key to how GPSLog Labs works.
A place is a position on the map (latitude and longitude) that you specify in GPSLog Labs. Such as Home, work, a friends place, the Gym, the start/finish line of race or track.
Places are used by GPSLog Labs to "chop" or "split" your log files into segments that travel between those places. GPSLog Labs will look for any log points within a certain distance of the place you've specified and if it finds any you will be considered to be "at" that place. This means that your activity logs start from when you "leave" a place and continue until you "arrive" at the next place. There is no need to note the time you start, or start your logger at exactly the right time, any setup or cooldown time at the end points will be automatically ignored.
Sessions
Sessions track the time you spend at a place, while either the logger is logging or it's switched off.
This can be used to track the amount of time you spend at a place, which could be useful if you are working out at a gym or swimming laps at a pool, or simply to tally up how much time you spend at work.
Routes
Routes allow you to classify logs between places.
Can be used to group logs that travel over "exactly" the same path, or to group logs that have something in common.
Routes fall into two general types: Circuits start and finish at the same place, for example a run or ride around the block or out and back along a path. Commutes travel between two different places.
To avoid having to create two routes, one for a commute from Place A to Place B and one for the return journey from Place B to Place A, GPSLog Labs will record a "direction" for each log along the route. This allows you to simplify the display of your activity, and also to compare logs to see how they differ when heading in each direction.
Logs along a circuit also have a direction, but this must be specified manually as GPSLog Labs doesn't know whether you went in the "forward" or "reverse" direction.
Checkpoints and Splits
Routes give you a lot of ways to compare your data, but there are some situations where more control is required, for example: You want to be able to compare sections along a route. You want to be able to compare common sections that are shared by more than one route.
Creating extra places would allow you to split your logs into smaller segments that could be compared, but you would lose the overview of your activity.
So, GPSLog Labs lets you create Checkpoints. Checkpoints are similar to places, but they are only active "inside" a route and they split each log into segments called "splits".
Checkpoints can also be shared between routes.
Tags
Tags provide another "free form" dimension to compare and organise your logs. Each log can have as many tags assigned as you like.
For each tag you will be able to summarise all your activity and view trends over time, as well as use the tag to locate logs and routes.
Your first "layer" of tags should probably be to classify the type of activity for each log (e.g. running, riding, walking, driving.)
After that, you can create further tags to group logs into any categories you like. For example competitive events vs training vs recreation. Or solo vs group activities.
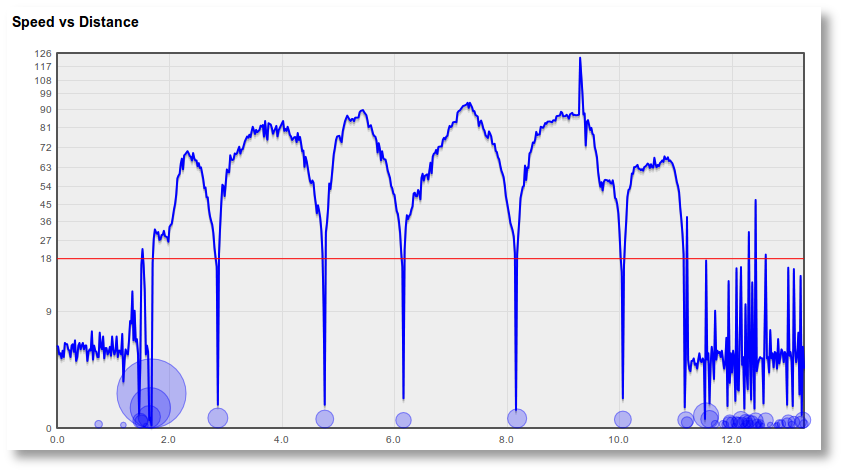
Speed vs Distance Graph
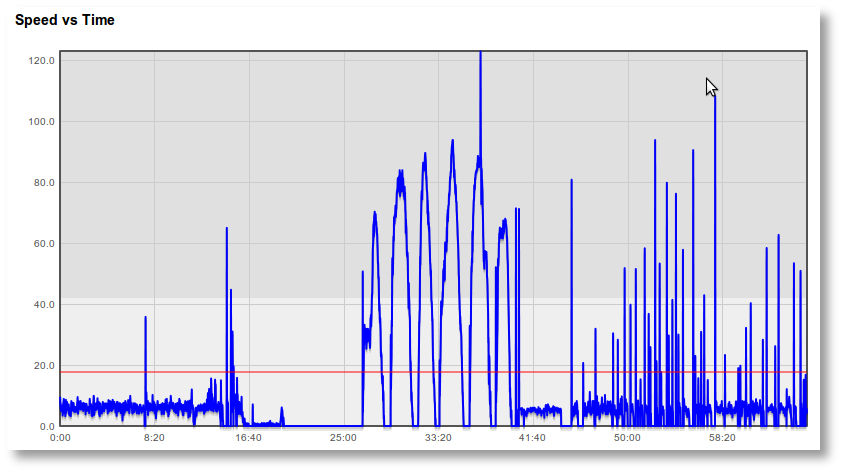
The following two images show the speed vs distance graph for a log as plotted by GPSLog Labs and the differences between it and a simpler speed vs time graph. The speed vs time graph is much simpler and can be plotted directly from the log file created by the GPS logger, but it can be harder to see the interesting information that way.
Y Axis Scale: The speed is "stretched" so that the grid lines are not equally spaced. This shows the most detail in the speeds most commonly found in the log. This is analogous to the "auto equalize" function available for digital photos.
X Axis Scale: By plotting the graph against distance logs are comparable to each other, regardless of how long specific stops are or how fast you travel.
Stops: Times when you are stopped are "collapsed" in the speed vs distance view and are shown as circles along the bottom of the graph. The size of the circle corresponds to the amount of time at that place.
GPSLog Labs © 2009–2018 Tom Paton | Privacy | Feedback | About | Language: English